
 Continue with onX Maps
 Sign in with Facebook


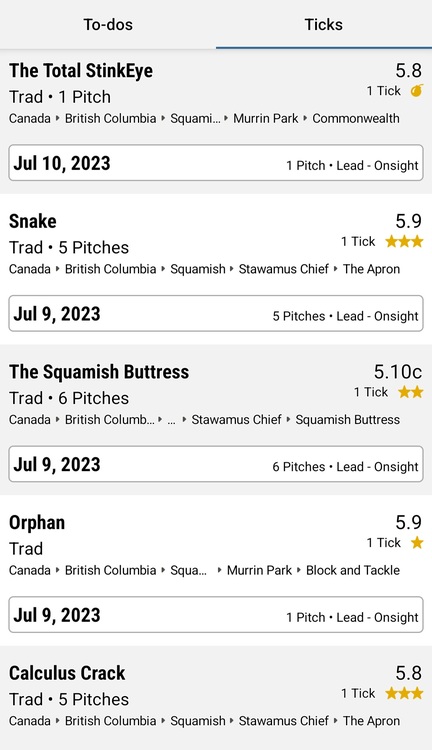
Visualize your MP Tick Pyramid

|
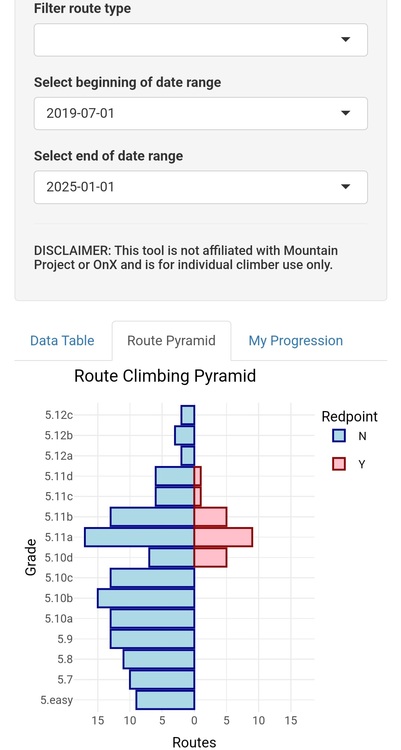
Want to see what your current tick pyramid looks like? I created the following web app to visualize a user's route pyramid based on ticks data, as well as a timeline of one's route progression: 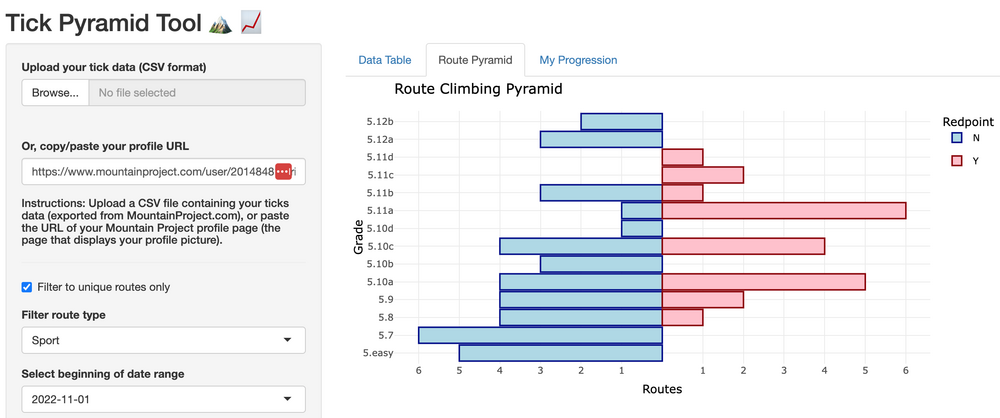 Open to feedback! For developers: GitHub Repo |

|
Super cool. Does seem to break if you have done more than 100 unique climbs of a grade |
|
|
I dont think i understand the pyramid. It seems like only red points are important but onsights are not? |
|
|
This is awesome dude, thanks for sharing! |
|
|
Levi X wrote: I don't understand R, but the python script in the main branch of the repo works for this 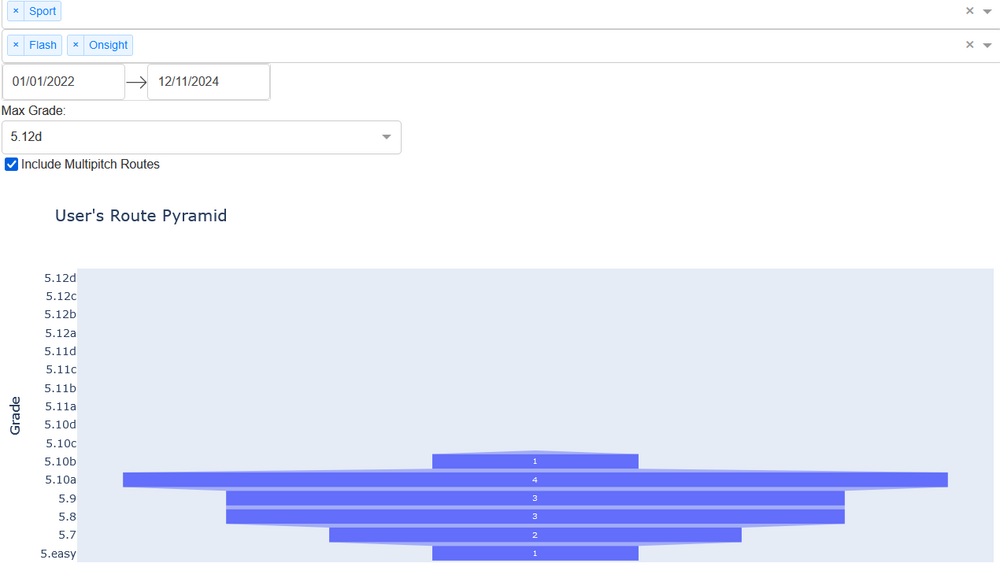 They seem to have the same criteria - maybe the R script parses the values differently? Someone who knows more can probably comment on ln 69-70 ``` mutate(Redpoint=factor(case_when( `Lead Style` %in% c("Redpoint", "Pinkpoint", "Onsight", "Flash") ~ "Y", TRUE ~ "N"))) %>% ```` |
|
|
Regarding the question about onsights, I didn't make a distinction between the various types of sends (onsight/flash/redpoint/etc). Instead I just considered them all 'redpoints'. Perhaps a better term for this would be 'sends'? Easy fix if so! |
|
|
Ray Pomponio wrote: Right now Onsight/Flash don't appear on the pyramid at all. For example, at 5.10a I only have onsight/flashes on my tick list, but nothing on the viz 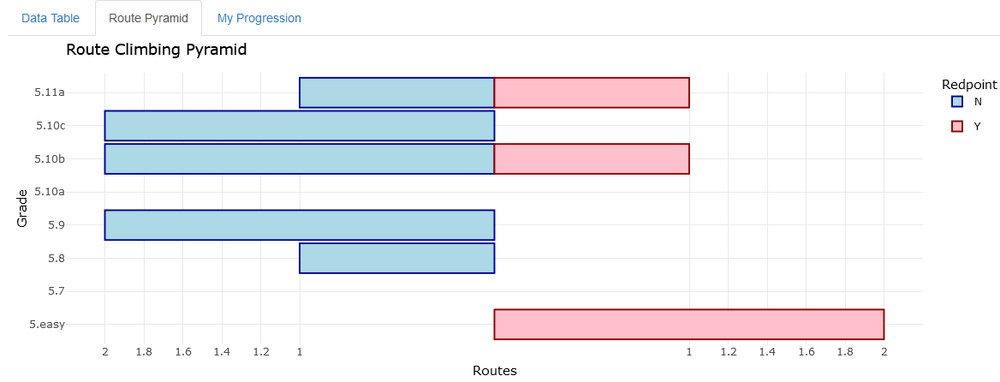 |
|
|
How exactly is this chart a pyramid? It is two histograms on their side. One histogram being normal the other being mirrored (upside-down). |
|
|
The 8a.nu website does this for you 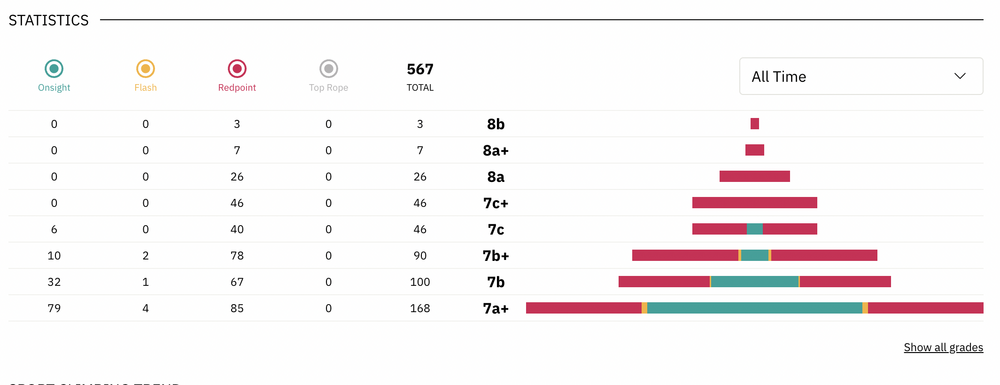 |
|
|
  I have plenty of onsight ticks for climbs under the mid 10 range but they are not showing up under the redpoint section of climbs. |
|
|
this is super cool, thanks for the development. |
|
|
just another "thanks!" |
|
|
Thanks all for the feedback — Yea I know you can do this on 8a.nu. A few folks pointed out a legitimate bug which was that the app would fail to show you the 'redpoint' category if there were a lot of routes compared to the 'non-redpoint' category (in other words, the pyramid was asymmetrically weighted towards more redpoints at that grade). It should now be fixed, for example here are some of the pyramids that weren't showing up correctly before: 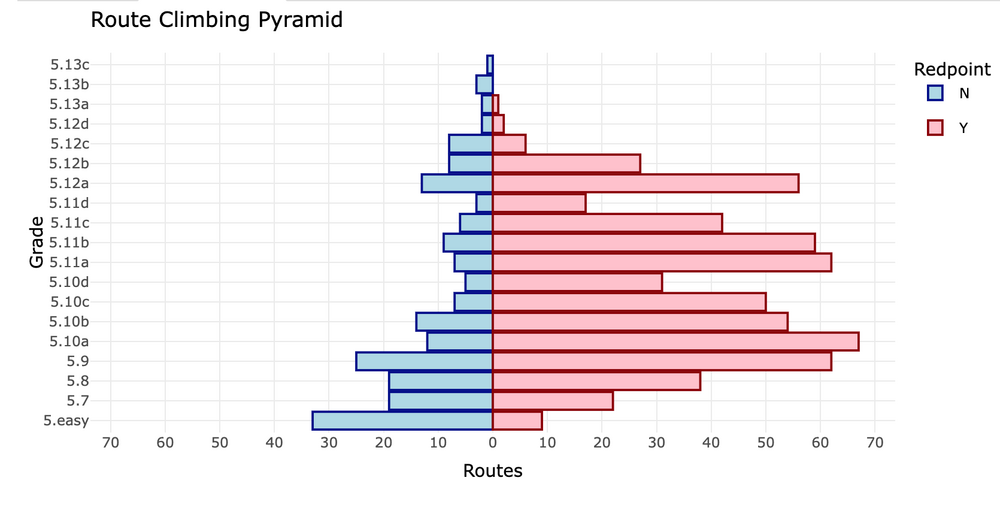 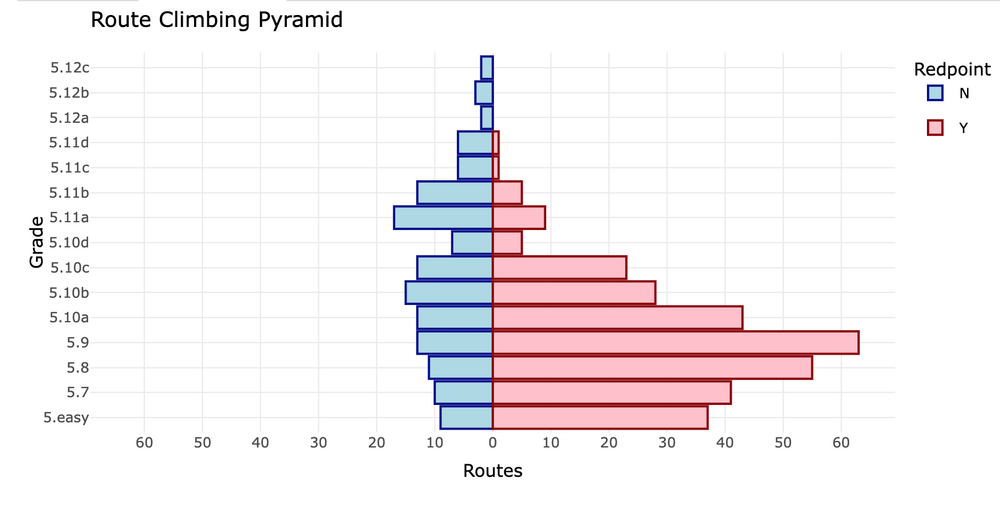 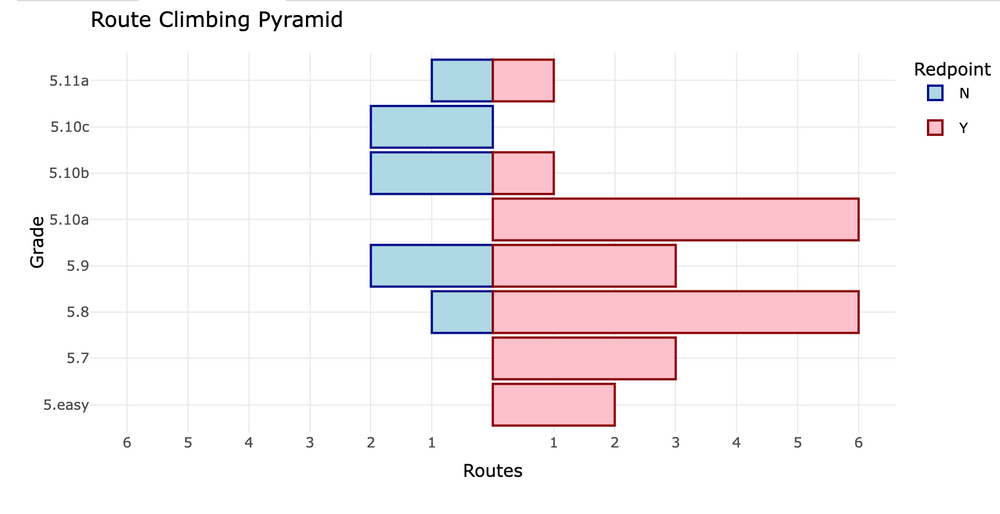 |


