
 Continue with onX Maps
 Sign in with Facebook





Max/Average Grade of Ticks for Crag by Climber: Example the Gunks



|
Disclaimer: I'm not good at stats, I didn't thoroughly test my code, there's probably a whole host wrong with how I went about this. I was just curious, not looking to start a fight over how shitty my data is.
tl;dr Less than 7 percent of climbers who report ticks on MP average leading cleanly at 5.9 or above in the Gunks. Less than 4 percent of climbers who report ticks on MP average leading cleanly at 10a or above in the Gunks. Less than 2 percent of climbers who report ticks on MP average leading cleanly at 10b or above in the Gunks. Roughly 20 percent of climbers who report ticks on MP have lead a 5.9 clean at the Gunks. Less than 18 percent of climbers who report ticks on MP have lead a 10a clean at the Gunks Less than 10 percent of climbers who report ticks on MP have lead a 10b clean at the Gunks Link to raw-ish data/graphs -------------------------------------------------- 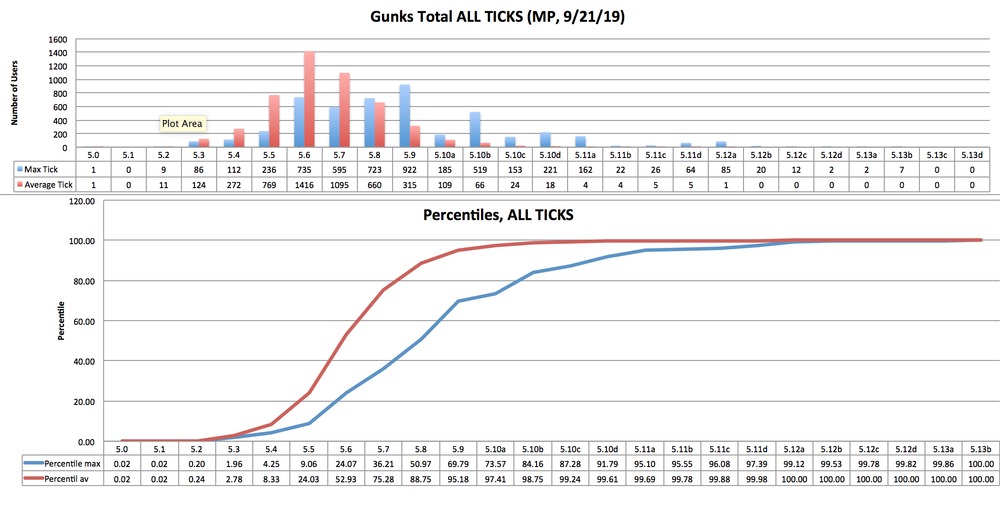 - Clean leads: all ticks with "Lead" in them and do not include "Hung" (i.e. lead / onsight, lead / flash, lead / redpoint) - Leads: all ticks with "Lead" and "Hung" in them (i.e. Lead / Hung/Fell) - TR: everything else. I took only those ticks in the "clean lead" bucket and replotted. Plots: Clean Leads at Gunks  Some other interesting things: - There are 4899 distinct profiles that have ticked a route in the Gunks - There are 95445 ticks in the Gunks (averaging to 19.5 ticks/profile) - There are 2391 distinct profiles that have ticked a clean lead in the Gunks - There are 25114 clean lead ticks in the Gunks (averaging to 10.5 ticks/profile) Edit: I realized that while ignoring slash grades is fine, ignoring plus grades is not. Updated to reflect. Edit 2: Here's the Grade distribution at the gunks  |
|
|
Interesting work! |
|
|
Here's what the Red looks like (I know this isn't a direct comparison, mixed sport/trad vs trad areas, but it was the next place I was interested in). 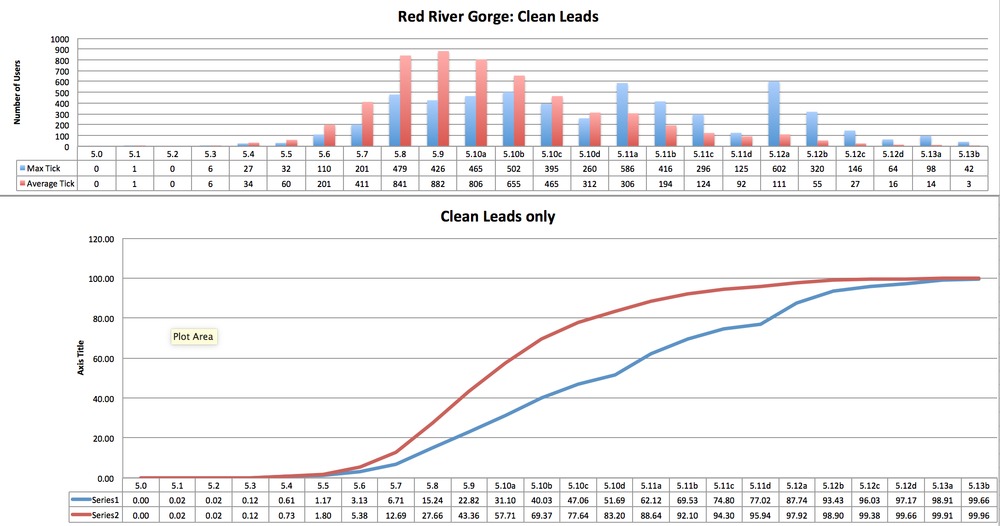 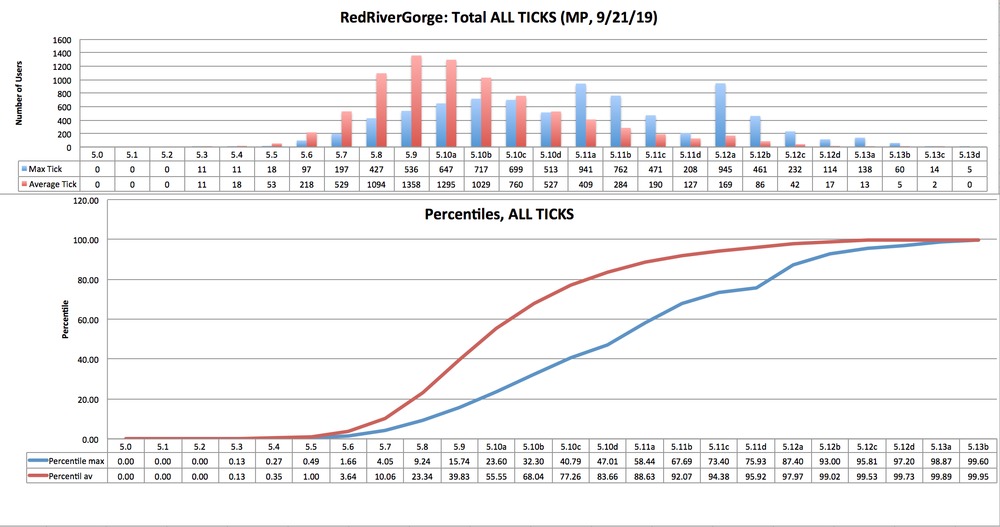 |
|
|
I would be very curious to see Yosemite Valley |
|
|
The 12a Effect is real, and even bigger than I'd thought it would be!
Great work! Do the rest of the major areas! |
|
|
Yosemite Valley   |
|
|
What's a tick? |
|
|
mark kerns wrote: What's a tick? A tick is a small, parasitic arachnid that can host viruses and bacteria that are harmful to humans. When recreating in an area known for having ticks, it is worth performing a complete check on one's body, to ensure nothing snuck on. The Gunks are more known for chiggers than ticks though, so I have no idea what the hell everybody is talking about. |
|
|
@Nkane is this what you're talking about? This is the number of total ticks at each grade. Makes sense if I'm trying to gauge traffic  |
|
|
Would love to see one for the Bow Valley as well as Squamish for us Canadians! |
|
|
Kalli Schumacher wrote: @Nkane is this what you're talking about? This is the number of total ticks at each grade. Makes sense if I'm trying to gauge traffic Yes! And the data supports my hypotheses about 5.7 and 10a! Thanks! |
|
|
Bump for Smith or Index |
|
|
Bow Valley 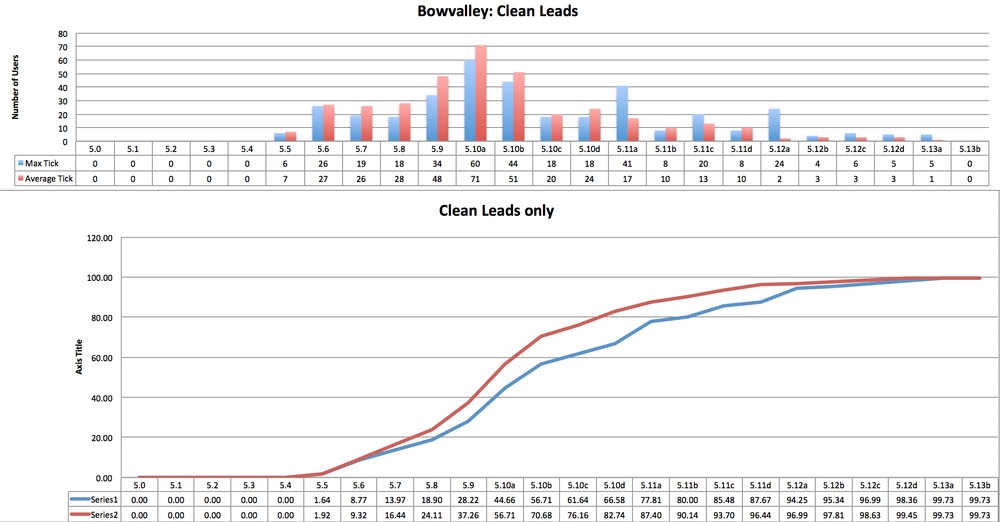 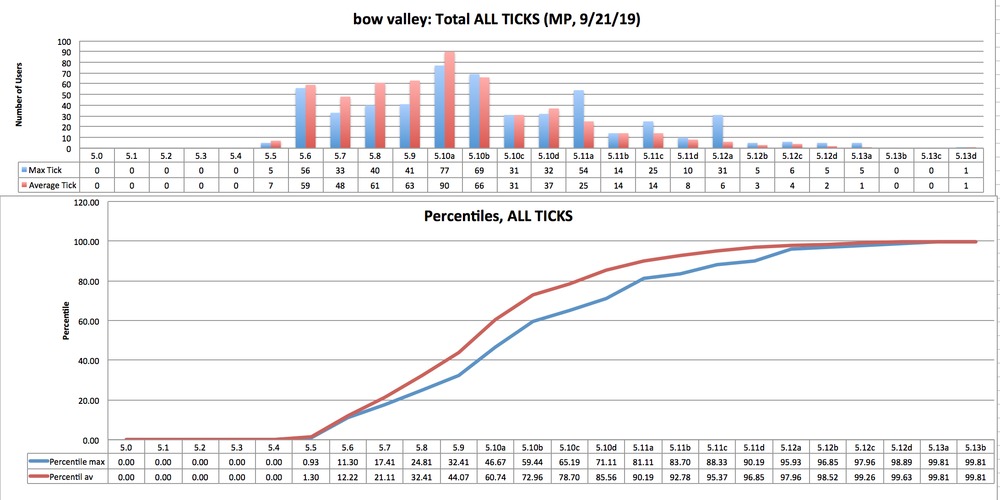 Squamish 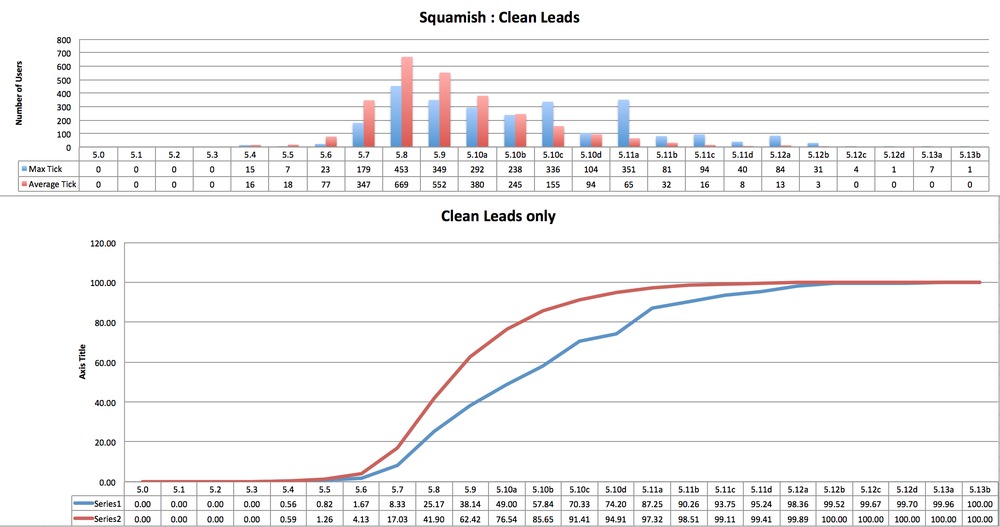 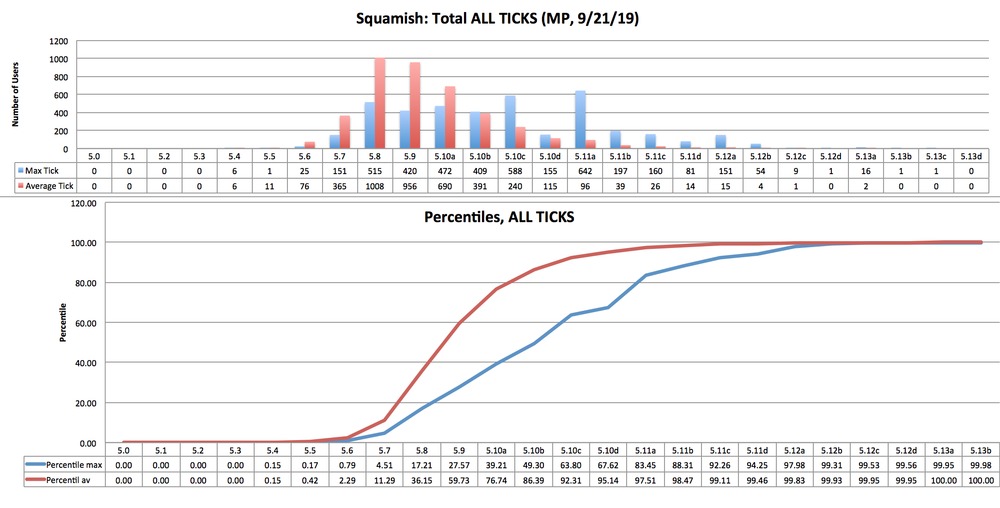 Smith Rock 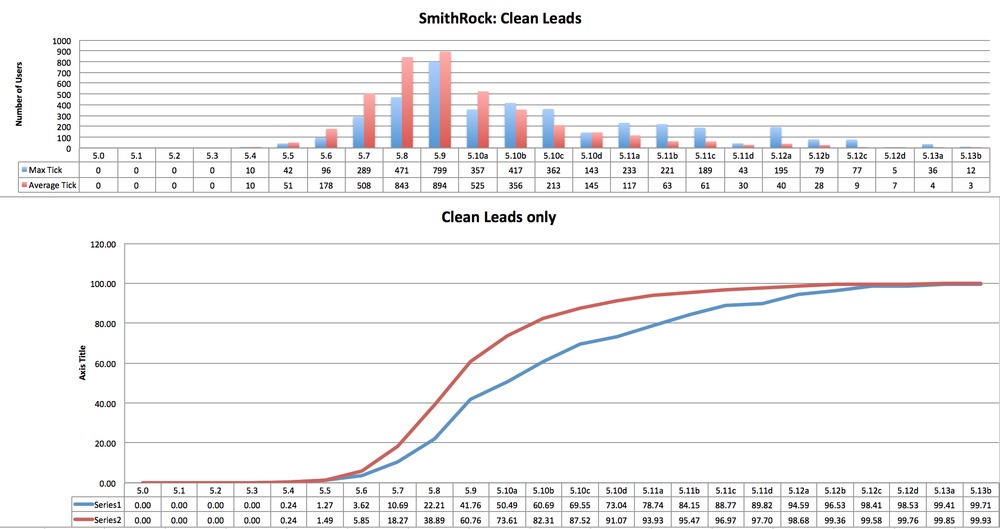  Pretty sure this is all correct? did it all pretty quickly... need to automate the middle jump or better yet just post the source code and y'all can run it |
|
|
Super cool, thank you very much. Now if there was only some magic way to know what percentile of the general climbing population one is in, not just within those that track climbs on MP. I feel like MP users who track ticks are going to skew to stronger climbers where your average 5.6 - 5.9 casual climber won't even know what MP is. |
|
|
Do rumney and red rocks! |
|
|
Kalli Schumacher wrote: Yosemite Valley Look at all those people not sending Serenity/Sons! |
|
|
wow this is really great. did you collect the data manually by scraping ticks? i didn't think their APIs had area ticks, though i would love that feature for this kind of analysis. |
|
|
As a math & stats nerd, this makes me happy. Nice! |
|
|
Chris Blatchley wrote: wow this is really great. did you collect the data manually by scraping ticks? i didn't think their APIs had area ticks, though i would love that feature for this kind of analysis. Yes, their API isn’t super useful. |
|
|
Kalli Schumacher wrote: Here's what the Red looks like (I know this isn't a direct comparison, mixed sport/trad vs trad areas, but it was the next place I was interested in). Data might be skewed - RRG has online guide that allows to keep track of routes climbed. It is more complete than mproj, the interface is better as well. As a result, people who mostly climb at RRG might be more inclined to use RRG guide. |
|
|
Luka Bogdanovic wrote: Super cool, thank you very much. Now if there was only some magic way to know what percentile of the general climbing population one is in, not just within those that track climbs on MP. I feel like MP users who track ticks are going to skew to stronger climbers where your average 5.6 - 5.9 casual climber won't even know what MP is. Here's the alternative hypothesis: |


